You’ve heard the talk at coffee shops: “How does that guy keep going, paying high cash rent? I can barely keep my head above water with low crop prices.”
There could be multiple explanations. Maybe he loses money on rented acres, hoping to make it up when better prices return rather than give up those acres. Or maybe he doesn’t realize how much money he loses. Eventually, reality will catch up, and he won’t stay current with bills and debt repayment.
There is a third possibility. Perhaps his real costs are simply lower than yours, making his net return per acre better.
Nathan Hulinsky, an Extension ag economist with the University of Minnesota, utilizes the FINBIN database often. Operated by UMN ag economists, it is one of the largest and most accessible sources of farm financial and production benchmarks in the world, Hulinsky noted. About 10% of all farm operations in Minnesota participate.
Data can be pooled anonymously to make observations about farm management practices, Hulinsky explained.
“Looking at cost of production, we see some surprising trends,” he said. “The variation in cost of production is much wider than you might expect.”
Cost of production
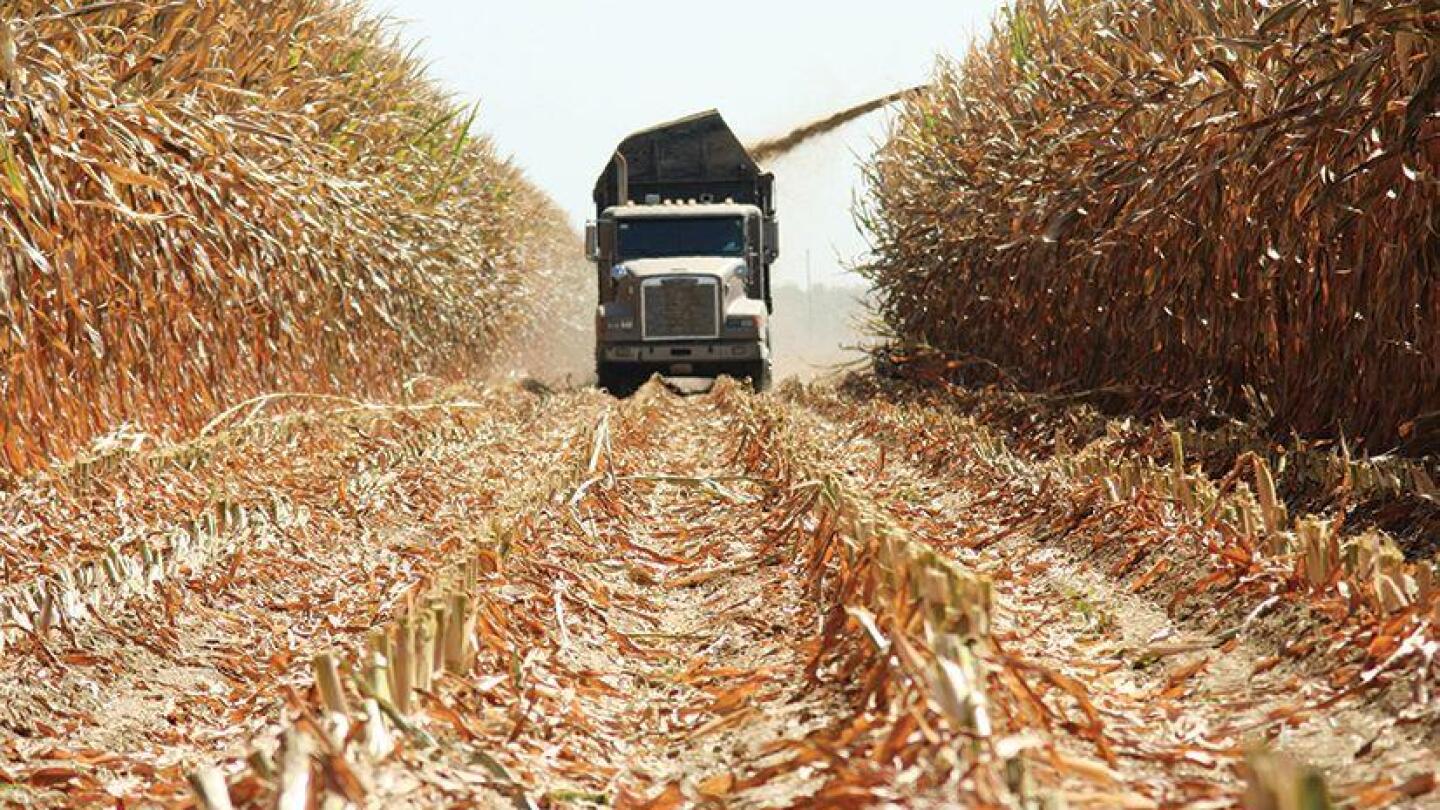
Based on 2024 FINBIN data, with 2025 numbers not yet summarized, average cost of production for a bushel of corn was about $4.71 for Minnesota farmers. It is well above the current corn price, hovering around $4.
In FINBIN data, cost of production includes both variable and fixed costs, including land, labor and machinery, Hulinsky observed.
“The kicker is how much variation we see for individual farms,” he continued. “We break results into 10% increments. In other words, we show results for the bottom 10%, next 10%, all the way to the top 10% of producers.”
Cost of production per bushel of corn ran from $6.92 for the lowest 10% of farm operations to $3.19 for the top 10% of farms. That is a spread approaching $4 per bushel!
“Obviously, low-end farms on this parameter are not making money, but top farms would be turning a profit, even at current low corn prices,” Hulinsky observed.
Various factors likely accounted for the differences, including yield levels. The higher the yield, the lower the cost of production per bushel, simply because total costs are spread over more bushels.
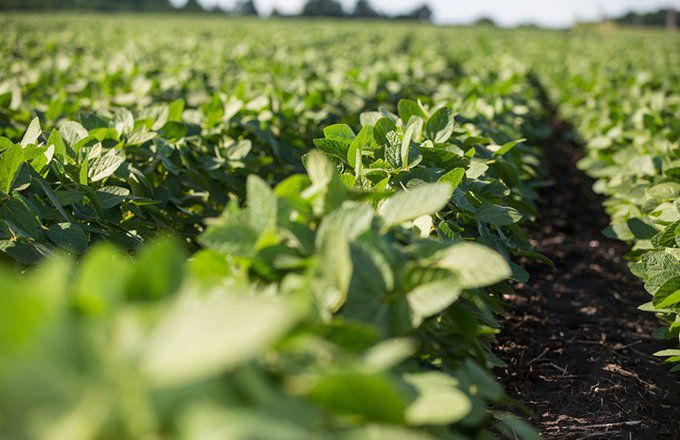
The story for soybeans was similar, Hulinsky said. The average was $11.02 per bushel for Minnesota farmers in ’24, with the bottom 10% reporting costs of $16.84 per bushel. The top 10% produced soybeans for $7.04 per bushel. That is almost a $10-per-bushel difference in cost of production!
Take-home message
The wide range in cost of production for both corn and soybeans is significant because it spells the difference between losing money, breaking even and turning a profit, Hulinsky said. Inefficient producers would likely not be sustainable over the long run.
“The bottom line is that you need to know your true cost of production per bushel,” Hulinsky said. “Run your numbers, and see where you stand.”
Once you know cost of production for both crops, you can look at factors leading to higher costs than you like and begin to make improvements, Hulinsky concluded.